Almost everything you put on a track does something to it, and you accept a small change in exchange. A meter does not. It reads what goes past and hands it on, and the whole job is showing you what it saw.
fMeter is free, and it always will be. No licence, no key, no trial period and no machine limit. It does not expire, it is not crippled in any way, and there is no paid version of it waiting behind a button. Install it on as many machines as you like.
It arrives as two programs in one download. fMeter is a VST3 that sits in your DAW and shows you what is happening while you work. fMeter Offline is an application that measures finished files, a hundred at a time if you want, faster than they would play. Both run the same measurement engine, so a file measured in one and played through the other give the same numbers.
A meter is not one thing. Different questions need different meters.
How loud does this sound?
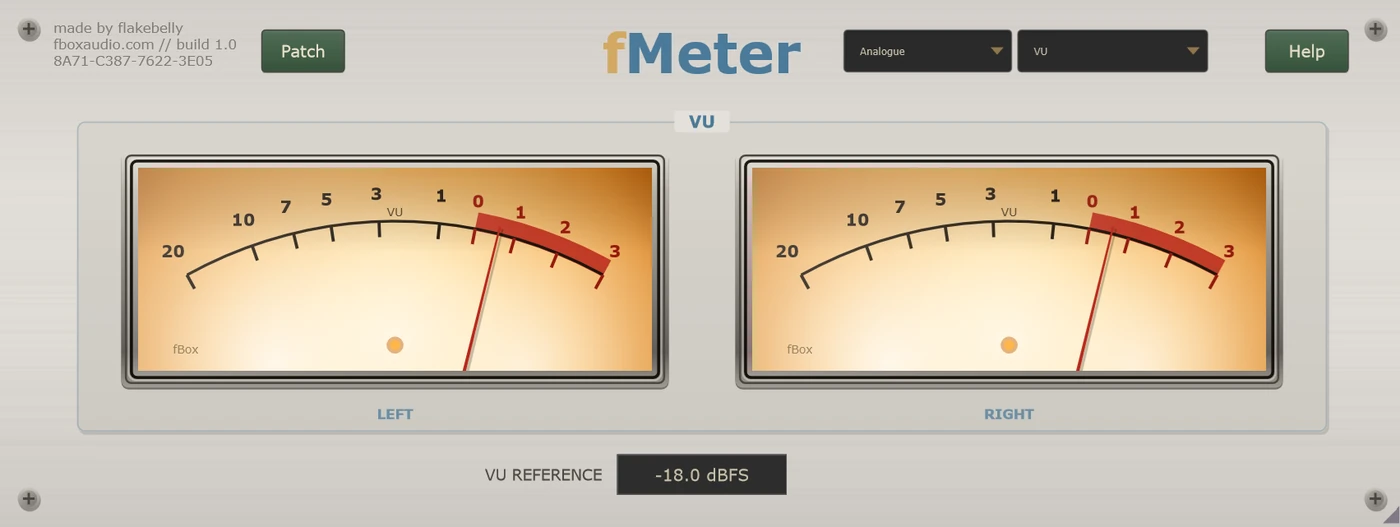
The oldest meter there is and still the best for balancing. The needle takes about a third of a second to arrive, so it rolls straight over short sharp sounds and shows roughly what your ear thinks the level is. Two needles side by side, and you read the gap between them rather than either number.
How big did that get?
The same pair of needles, reading peaks. It rises almost immediately and catches the sharp sounds a VU rolls over, then falls back slowly and evenly so you have time to read what it caught. Fast up, slow down, which is what makes a peak readable at all.
Am I about to distort?
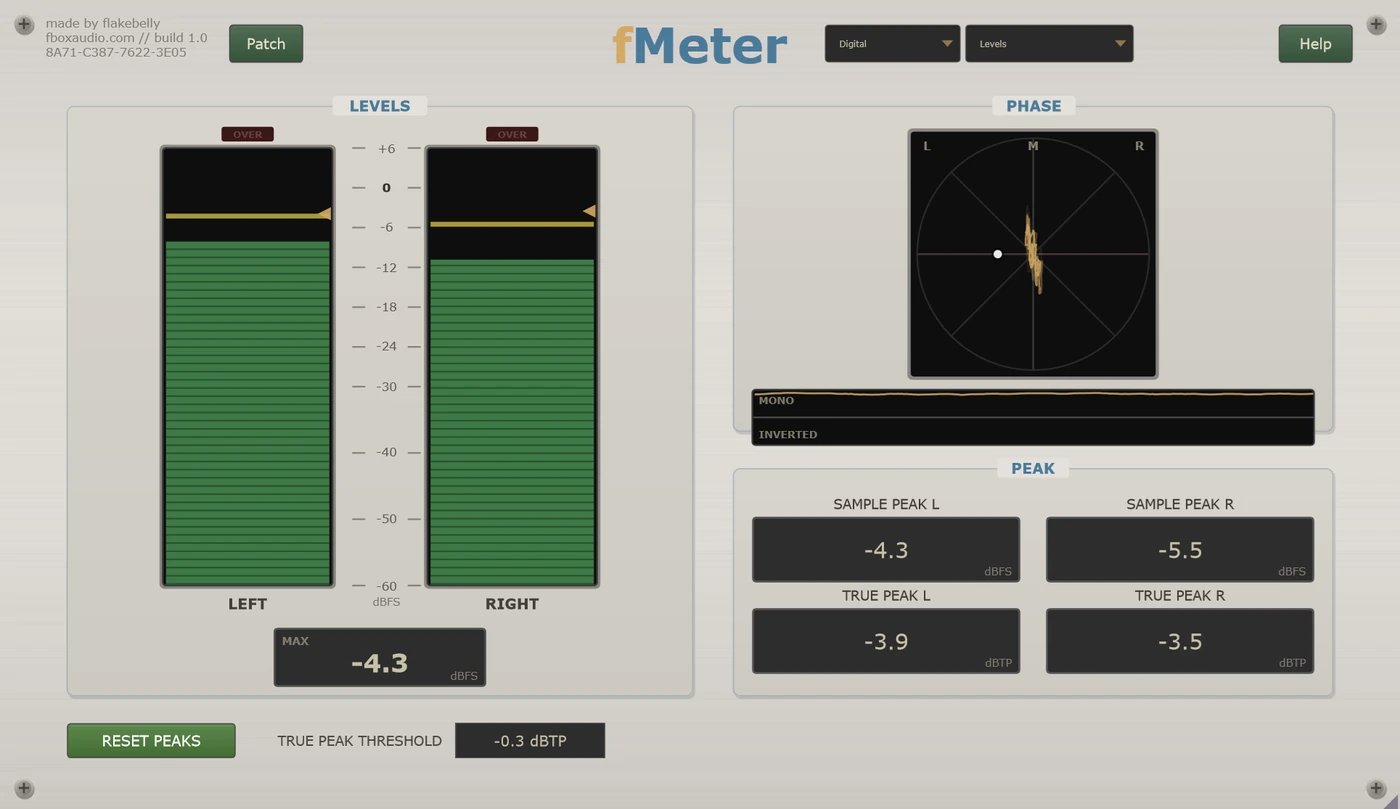
Bars with over lamps, sample peak and true peak as figures, and a phase scope beside them. VU and PPM are for mixing; this page is for finishing. It is the one to check when a mix is about to become a file that leaves your computer.
How loud is the whole thing?
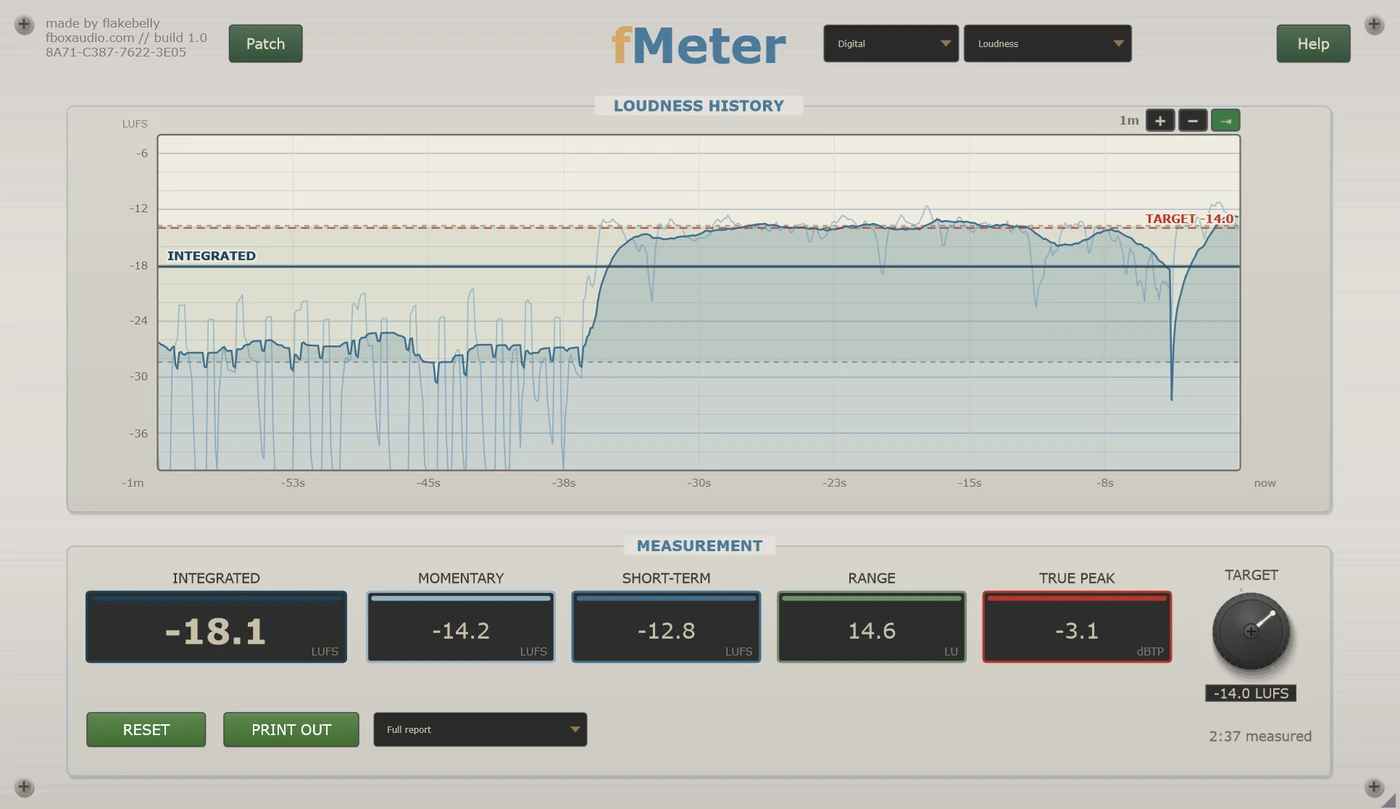
A chart drawing loudness over time with the figures underneath, measured the way streaming services and broadcasters measure it. This is where the number in every delivery specification comes from.
Not almost untouched. Untouched.
Render a file through fMeter and it comes out bit for bit the same file. There is no wet and dry, no trim and no bypass blend, because there is no processed path for them to act on. Nothing it shows you is a side effect of anything it did.
It adds no delay of any kind and takes no part in your DAW's delay compensation, so adding or removing one cannot shift anything in time. Leave one on every channel if you want to.
There is no Eco, Studio or Master selector either, and no need for one. The rest of the range offers those because their character can be run lighter or heavier. fMeter has no character to run.
The two things that go wrong after you stop listening
A mix can be pushed past the ceiling, which flattens the tops off the waveform and sounds like a crackle on the loudest moments. Or it can look perfectly safe and still distort later, once somebody plays it through a phone or a streaming service converts it. Neither is obvious while you are working.
Sample peak catches the first. True peak catches the second, by measuring how high the smooth curve drawn between your samples really gets rather than the samples themselves. That curve can bulge above the highest number in the file, which is why delivery specifications are written in true peak, and why a master that was clean on your system can crackle on somebody else's.
Beside them sits a goniometer and a phase strip, answering a different question entirely: will this survive being played in mono? Anyone on a phone speaker, a club system or a radio is hearing your mix summed. When it goes wrong you do not hear a glitch, you hear an absence: the bass goes hollow, and an instrument somebody spent an afternoon on is simply not there. A flat horizontal line on the scope is the shape that matters.
The figure everybody asks for
Peak tells you nothing about how loud something sounds. A single sharp click can reach the ceiling and be almost inaudible; a thick bass note can sound enormous and peak much lower. Loudness is the measurement that matches your ear, and it is the one written into every delivery specification.
The chart draws it as you play, with your target as a dashed line across it. Watching the integrated reading settle onto that line is the point of the page, because you can see whether a mix is going to land without reading a number at all. Five readouts sit underneath, and each one is also the button that draws its own line on the chart.
Treat a target as a tool rather than a rule. Plenty of commercial releases measure a long way above the figure that gets quoted, and the engineers who made them know exactly what the number is and deliver louder anyway. If somebody has handed you a figure you have to hit, this is how you hit it exactly. If nobody has, it tells you where your mix sits so you can compare it against records you already trust.
The application, for files that already exist
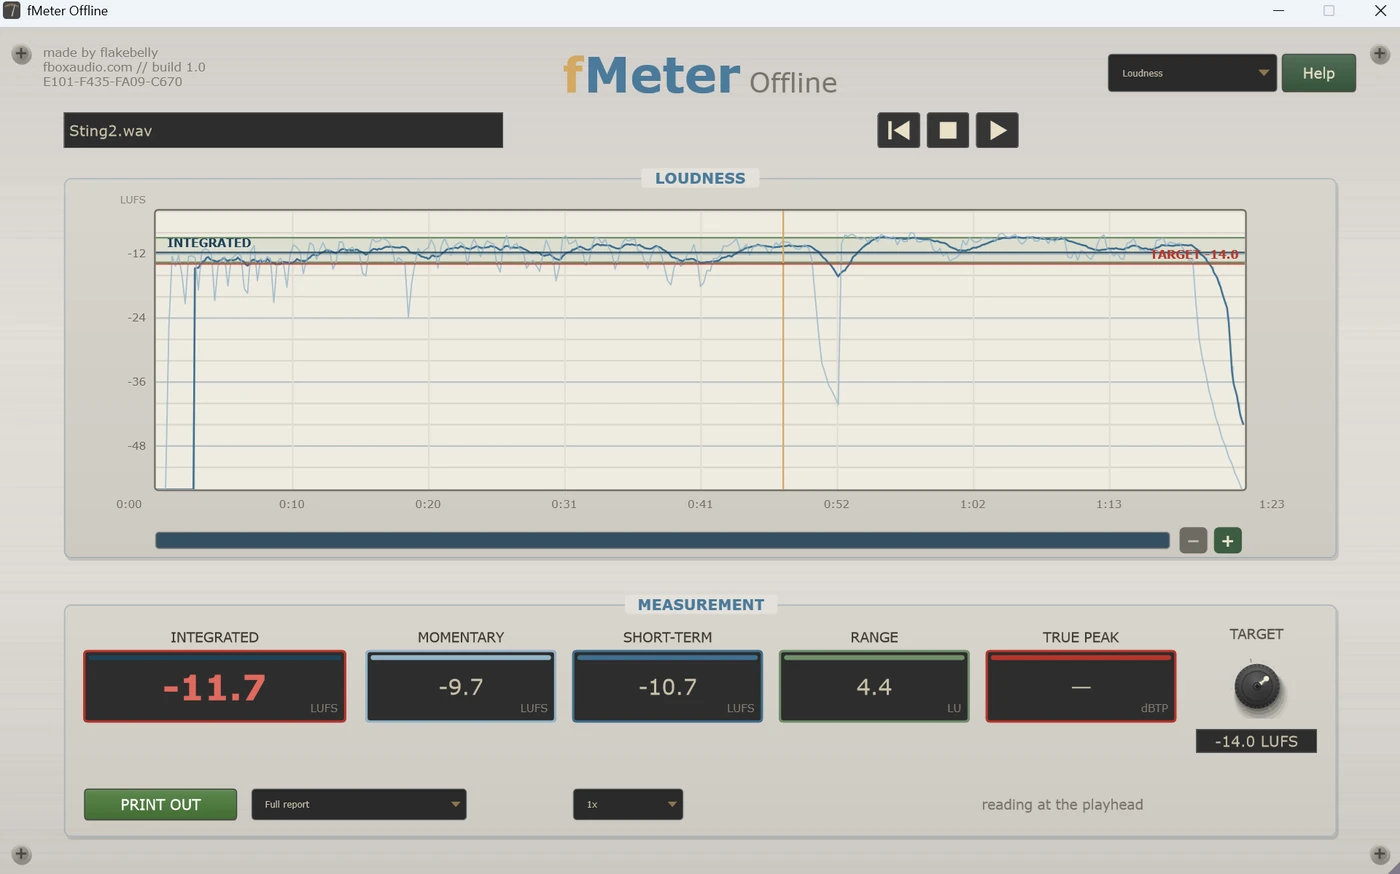
A meter inside a DAW can only measure what goes past it while something is playing. fMeter Offline measures files that already exist, all of them, without playing anything. It has no audio device at all, which is how it reads an hour-long file in a few seconds instead of an hour.
Point it at one file or a hundred. WAV, AIFF, FLAC, Ogg, MP3 and Windows Media are all read, and each gets a row with its integrated loudness, range, true peak, highest sample peak and a count of overs. Anything more than a decibel from your target turns red, and so does a true peak above your threshold. That is the whole delivery check, at a glance, down a column.
Load an album in track order and read the integrated column top to bottom. The tracks that will feel wrong on a playlist are the ones that jump out, and you will spot them faster down a column than by ear across an afternoon. That is the thing this does that the plugin cannot.
The list. One row per file with its figures, sortable, and a report covering the rows you select or all of them. A file that cannot be read still takes a row, in red, saying so.
The whole file on one chart from the first sample to the last, rather than only what has already gone past. Scroll and zoom anywhere in it.
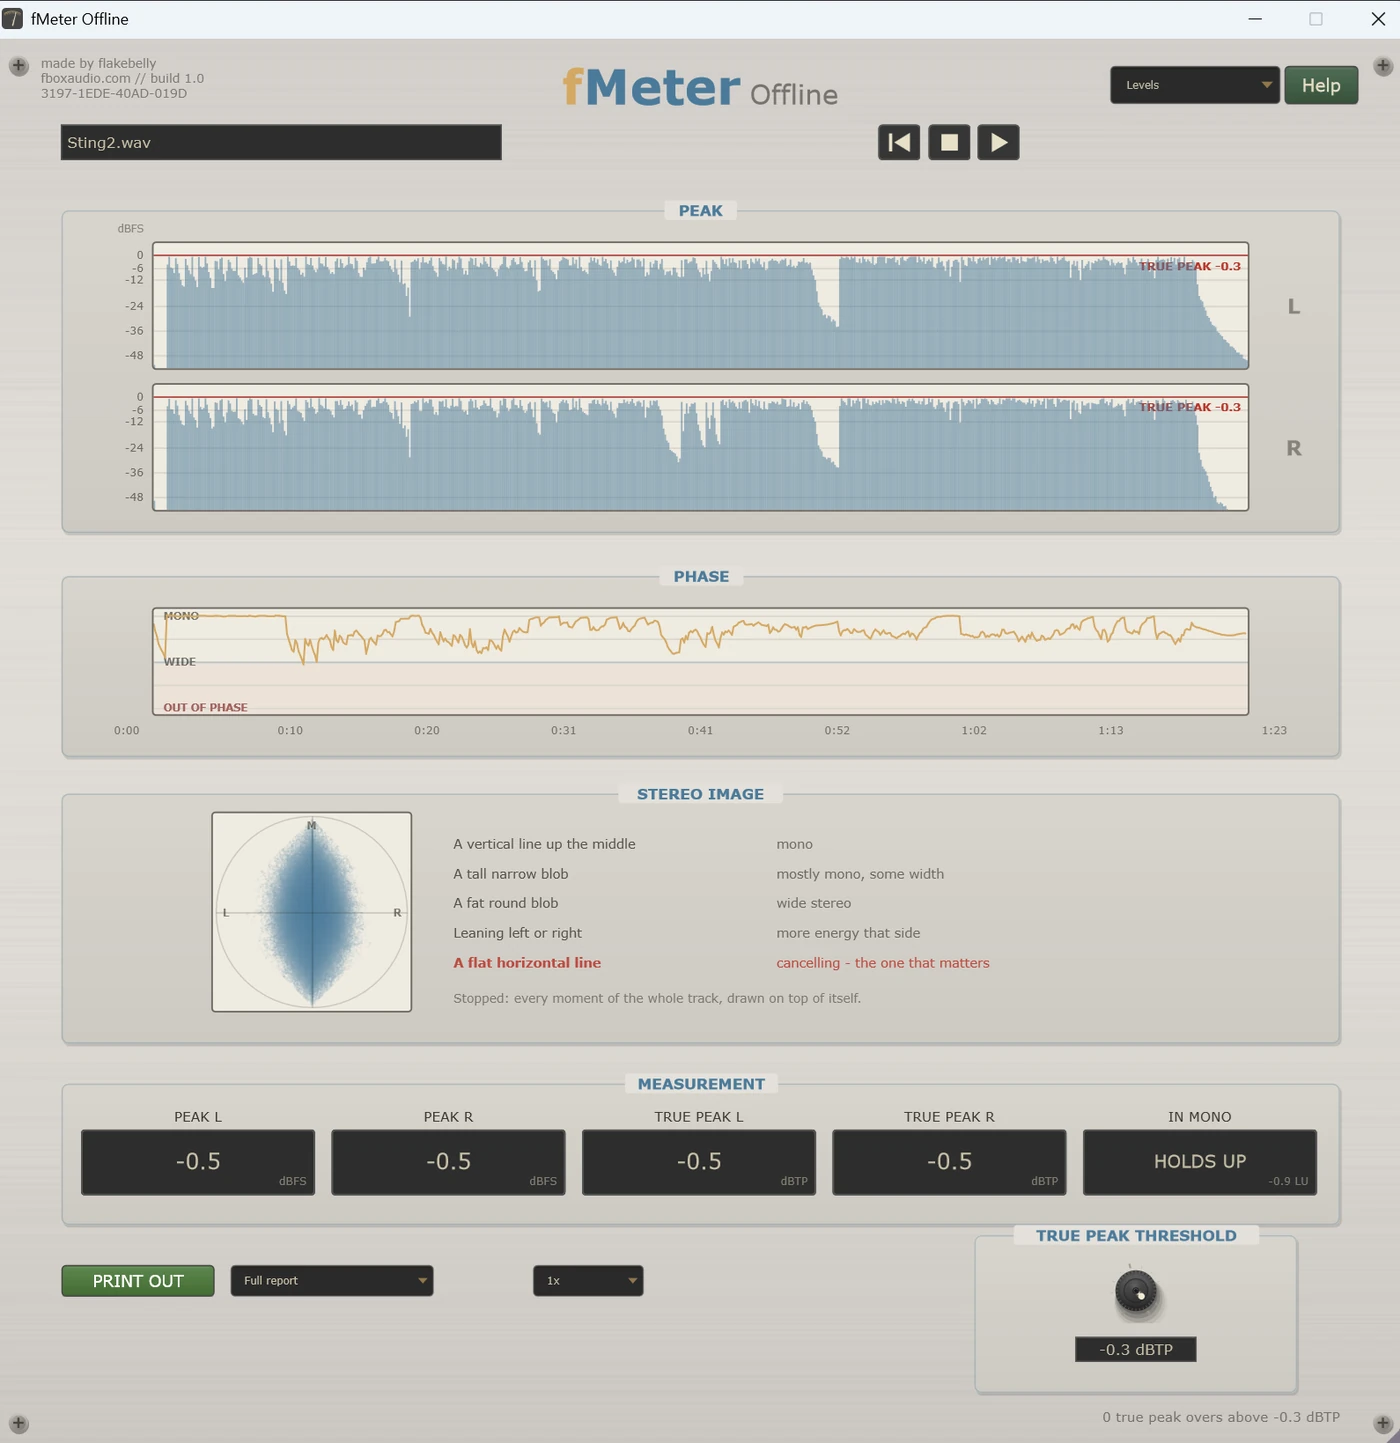
Peak lanes for both channels with your true peak threshold drawn across them, and a red mark at every moment that crossed it, placed where it happened. The correlation strip, the stereo image and the IN MONO reading sit below.
It walks a marker through a measurement already made, at one, four or sixteen times speed. Nothing is played. Sixteen is how you find the moment you did not expect.
Where the plugin's scope shows the last fraction of a second, this draws every moment of the whole track on top of itself, so the brighter a part of it is, the more of the track was spent there. Run the playhead and the moment under it is drawn over the top in gold.
One reading on that page answers a question rather than reporting a number. IN MONO sums the file to mono, measures its loudness, and compares that against the stereo original. The difference is how much of the mix disappears when the two channels are added together, which is what anybody listening on a phone speaker, a club system or the radio is hearing.
It reads one of three words, with the figure in LU underneath. HOLDS UP means nothing meaningful cancels. THINS OUT means something wide is fighting itself and is worth listening to in mono. COLLAPSES, in red, means something is inverted and you have a real problem. A wide mix always loses a little, because sounds spread across two channels are quieter once they are added into one, so anything under about 1.5 LU is normal.
It describes the whole file rather than its worst instant, which is the point of it. A track that dipped for a tenth of a second is not a track with a phase problem. The strip above still shows you where in the song to listen, and the worst single reading is still on the printed phase report, which is where a worst-case number belongs.
Printed reports, from either program
In the plugin it is the Loudness page that prints. In the offline application every page does, the file list included, so a single sheet can cover a whole album. Either way a sheet lays over the panel with the figures frozen at the moment you pressed the button, so what you read is what you send.
Choose a full report, a loudness summary, a dynamic range sheet, a peak summary, a phase report, a true peak log or a delivery check. Each one draws only what it is about, and all of them carry the short-term trace faintly underneath, because it is the only thing that tells a reader where in the song anything happened.
Save it as an image and it pastes straight into an email or a message, with nothing needed at the other end. Send one along with the bounce and it answers the obvious questions before anybody has to ask them, and settles any later disagreement about what you actually sent. There is a plain-text version too, worth keeping in the project folder because it is searchable.
Every fMeter reads the same. That is the point.
On every other product in the range that serial means something. It defines the unit's character, the small manufacturing differences that make that instance sound like that instance and no other. Two fVerbs do not sound identical, any more than two real reverbs do.
fMeter does not work that way, and deliberately so. Its serial is a nameplate and nothing more. Character on something that processes sound is the whole idea. Character on something that measures would be a fault. If one fMeter read 14.2 LUFS on a file and another read 14.4 on the same file, one of them would be wrong and you would have no way of knowing which.
So every fMeter reads exactly the same as every other fMeter, and as any other correctly built meter. The loudness standards are public documents, and a meter that implemented them with a personality would be implementing them incorrectly.
The serial is on the panel because the panel belongs to a range where every other unit has one. It does not appear on a printout, where it would imply a calibrated instrument identity this one does not claim.
No licence, no key, no trial period, no machine limit and no expiry. There is no paid version of it.
The VST3 plugin for while you work, and the offline application for files that are finished. The same measurement engine in both.
VU and PPM needles, the Levels page with peak and phase, and a live loudness chart.
Render through it and the file is identical. No wet and dry, no trim, no processed path at all.
It takes no part in delay compensation, so one on every channel shifts nothing in time.
The measurement every delivery specification is written in, plus a goniometer, a correlation strip, and a single reading telling you whether the mix survives being summed to mono.
Drop a folder into the offline application and read the loudness column top to bottom. Faster than real time, with a report over the lot.
An image you can paste into a message, or plain text you can search. Send one with the bounce.
Free forever - nothing to buy, nothing to activate
The zip holds the plugin, the offline application, and a one-page start guide and full PDF manual for each. New to this, or not sure where a .vst3 goes? Read the install guide.